High Rates Drive India’s Public Debt. Austerity Will Drive India Off a Cliff
Guest Article by Advait Moharir
This is a Guest Article for Notes on the Crises. Thanks to the generous support of our paid subscribers, we can now afford to have guest writers
Advait Moharir is a Research Assistant at Azim Premji University. He is currently working on the CORE Project, helping develop materials for an economics textbook being written for the South Asian context. His interests lie in the fields of macroeconomics, monetary economics and public finance.
On 31st August, the National Statistical Office released India’s GDP figures for the first quarter of FY 21 (April-June). These numbers have spawned much debate over whether the contraction of -23.9% is in line with predictions, and if the economy will bounce back in the next quarter. But another thorny question has been lurking in the background — is India’s debt too high?
In a speech given just after presenting the Budget in February 2020, just a month before the coronavirus struck, here is what India’s Finance Minister had to say:
I am a government Minister. There is a law under FRBM [Fiscal Responsibility and Budget Management Act] where we have committed ourselves for the gliding path for the adherence to achieving 3 per cent (fiscal deficit) limit set on me. Till such time the law exists, I have to comply,
Such strong statements reaffirming commitment to limiting the fiscal deficit (which is the difference between revenue and expenditure) are not new in India. Almost every Finance Minister preceding Sitharaman has made a statement of this nature at least once (examples are here, here, and here). Words like ‘fiscal discipline’, ‘glide path’, ‘deficit target’ are used often to reinforce the importance of being prudent.
With the coronavirus still at large, many countries have run big fiscal deficits and announced stimulus packages to keep the economy afloat. Spending levels have gone up in India too. Some economists have argued that in the middle of the pandemic, reviving the economy entails doing “whatever it takes”, in the words of Fed Chief Powell. In other words, a rise in debt levels is not a matter of immediate concern. However, this emergency spending sparked fears among pundits that the public debt will spiral out of control; with many stressed that the government needs to return to a ‘sustainable’ debt regime. Such suggestions started coming in from as early as May, when the pandemic was spreading fast.
So in light of this global picture of uncertainty and shaken orthodoxies, why is it that a specific number (3%) has captured the imagination of Indian policymakers? Why have Indian policy makers still accepted terms that tether them to a path of austerity? Why stick to this limitation, even while the pandemic still looms large?
Every few months, there are articles tracking what percentage of the fiscal deficit target has been spent (here, for instance). And more often than not, if the fiscal deficit is above the 3% level, alarm bells ring, with journalists writing about ‘fiscal black holes’ and fund crunches. The entire narrative around debt sustainability in India is framed in the context of these ‘targets’ and ‘rules’. But what do these terms really mean? To explain this, we need to take a slight detour.
A Short History of Fiscal Rules
A fiscal rule is simply a target for a particular debt indicator that the government has to achieve over a period of time. In 2003, the Indian government promulgated the Fiscal Responsibility and Budget Management Act. This defined the first indicator of debt sustainability — the Act stated that India’s fiscal deficit should not exceed 3% of the GDP. This target was set to be achieved by 2008.
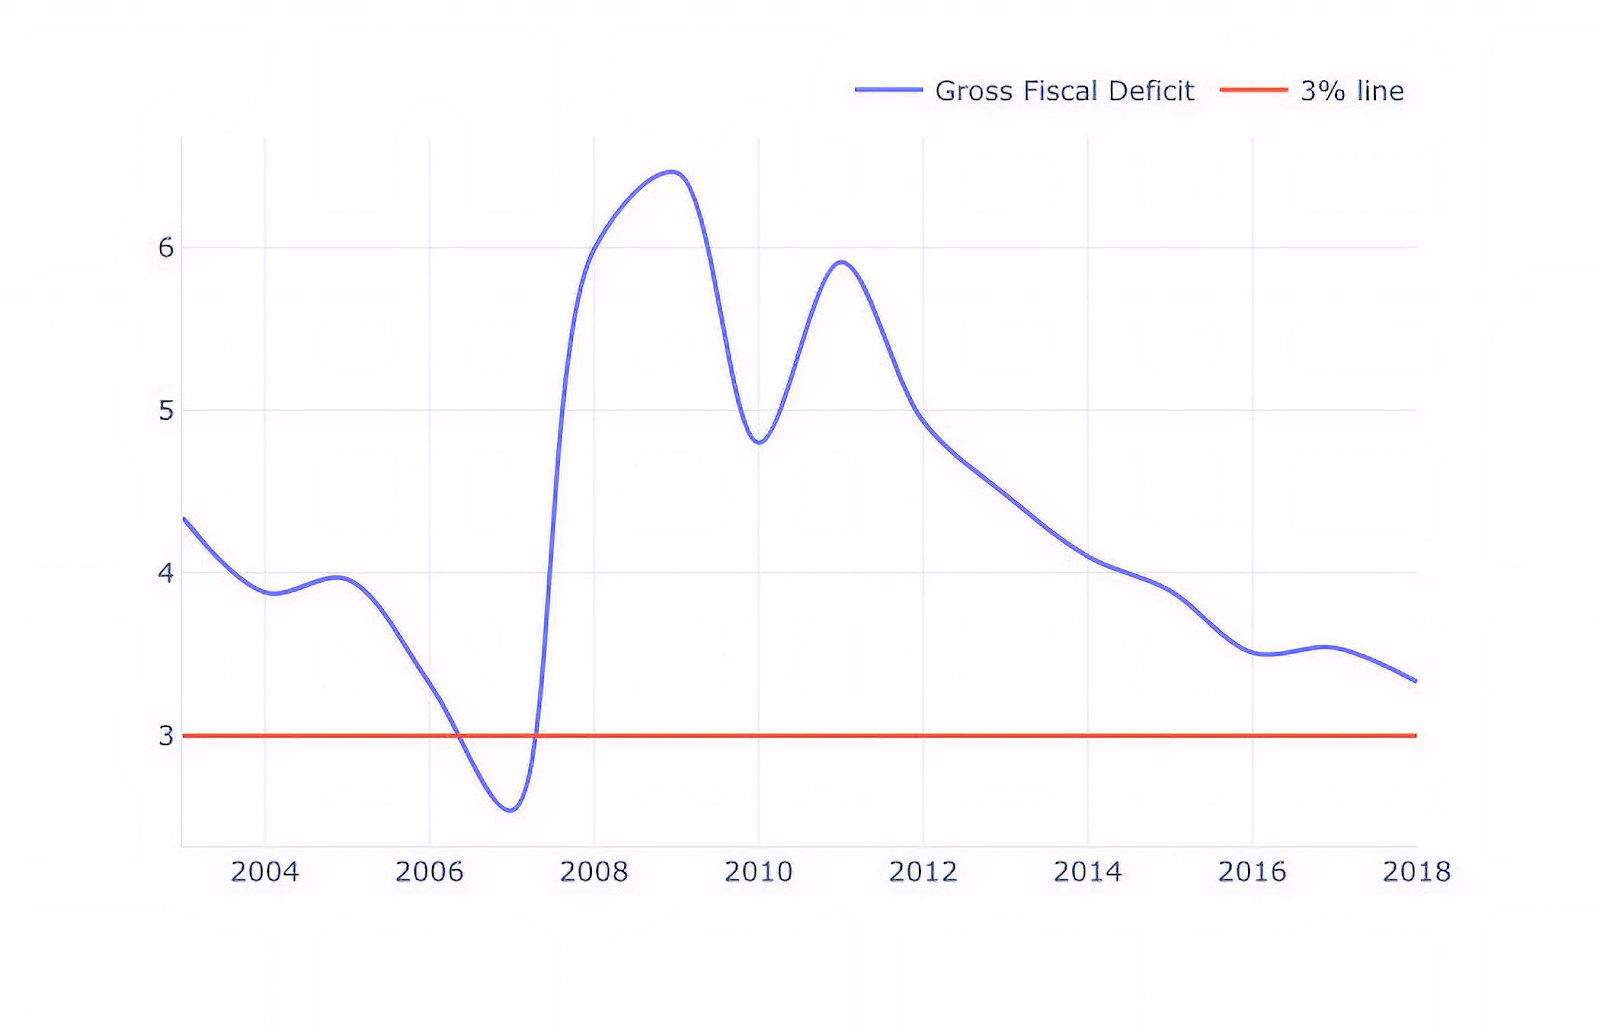
Figure-1 Gross Fiscal Deficit as a percentage of GDP
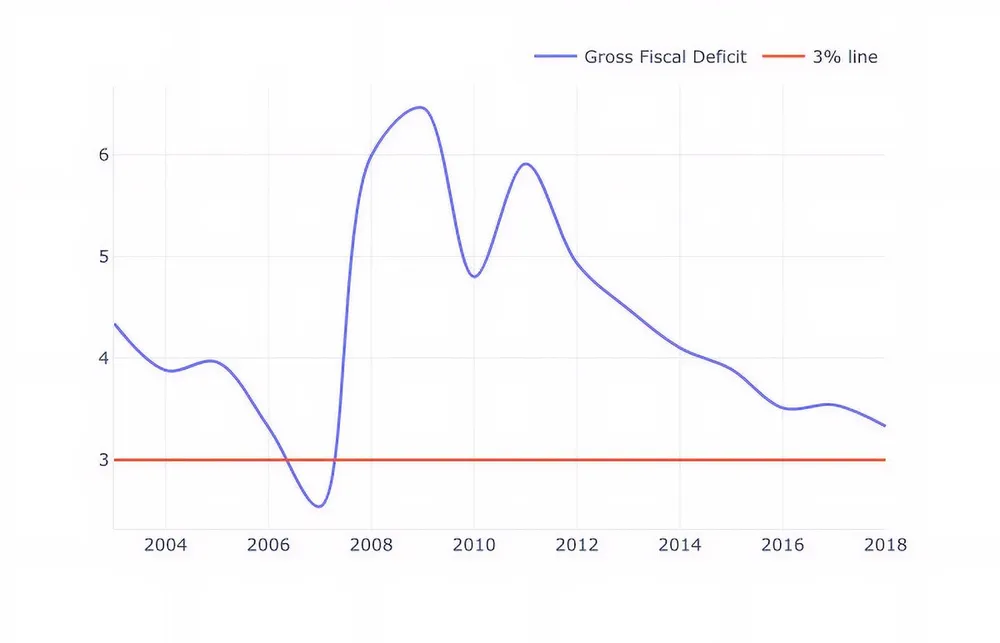
As Figure 1 shows, the 3% target was ‘hit’ only once, with the deficit spiking due to repeated stimulus packages announced in the wake of the Global Financial Crisis of 2008. Even though the government set itself a target, it found itself overshooting it. This happened because growth was unwittingly prioritized over debt sustainability. With the 3% target failing to achieve the stated goals, an FRBM Review Committee was set up in 2015. The Committee’s Report, released in 2017, noted the limitations of the deficit target, and recommended that the current FRBM framework be abolished.
However, a new indicator of sustainability was identified — the debt-to-GDP ratio. The Committee stated that the debt-to-GDP ratio shouldn’t exceed 60% by 2023.
Why is this change in targets important? To understand this, we need to know how exactly debt evolves over time, it all boils down to one equation.
The Law of Debt Movement
Once referred to as 'the least controversial equation in macroeconomics', the equation is

The equation says that change in the debt ratio is due to three components. First, the debt ratio will rise if new borrowings increase (also called ‘primary deficit’). However, total liabilities also rise due to the interest rate accrued on the previous year’s debt —captured by the (1+Interest Rate). The overall debt ratio also falls, when there is an increase in the growth rate- this is simply because growth rate increases the size of the GDP, which is in the denominator. This reduces the debt ratio. This term is called the interest-growth differential, or simply (i-g).
Finally, there are some miscellaneous components like debt cancellation- called stock-flow adjustments, which can lead to a rise or fall in the debt ratio — depending on the sign. Stock-flow residuals are calculated as a residual, which means that statisticians assume that whatever mismatch between total debt levels and the other components of our equation come down to this factor. For national public debt in India stock-flow adjustments are not quantitatively very important, so we can ignore them. This factor matters a lot more for the private sector — where individual firms and households regularly default and go through bankruptcies
The equation is in some ways simple, but there are a couple of subtleties worth noting.
One: debt doesn’t equal borrowing. This sounds very counterintuitive, but since the debt ratio also depends on the effect of growth and interest rate on the previous years’ debt, this direct equivalence does not hold.
This helps us answer the question from the previous section — the old FRBM target was the fiscal deficit. This is what economists call a flow- something measured over a time period. Here, debt equals borrowing, as there is no other component determining the trajectory. However, the new target — the 60% debt-to-GDP ratio — is a stock. A stock is something that is measured at a point in time. As the equation points out, there is more than one determinant of the trajectory here. In other words, the simple equivalence of debt just being the sum of new borrowing is fallacious.
Two, at relatively ‘low’ levels of debt new borrowing, will contribute more to debt change than the second term. This is because the size of the second term i.e.

is going to be very small, as the initial debt ratio is small. However, after a particular level of debt, this term becomes much larger. It now contributes more to debt change than new borrowings.
Why is this important? If the government wants to reduce the debt ratio, and the debt ratio is ‘high’, then reducing new borrowing will not be effective. Instead, cutting interest rates, or growing the economy faster will help. These two variables have more power in determining the debt trajectory. To summarize, the relative strength of the primary deficit and the interest-rate growth differential in determining the debt trajectory depends on the starting debt level.
Finally, you will notice that the change in debt depends on how the size of the numerator (Liabilities), changes compared to the size of the denominator (GDP). So, if the nominal growth rate exceeds the nominal interest rate, then the debt ratio will stabilize. This inequality, g>i — also called the Domar condition — tells us whether the debt will rise indefinitely, or if it will stabilize.
This simple accounting identity has equipped us with everything we need to understand debt dynamics, speaking generally. Let us now delve deeper into the specific question of Indian debt.
India’s Debt Dynamics
In my recently published paper, I try to answer the question: what factors drive the evolution of India’s public debt. I ‘decompose’ — or in other words, ‘separate’ — the change in the debt ratio from the period 1980-2017 in two parts — changes due to new borrowings, and change due to (i-g).
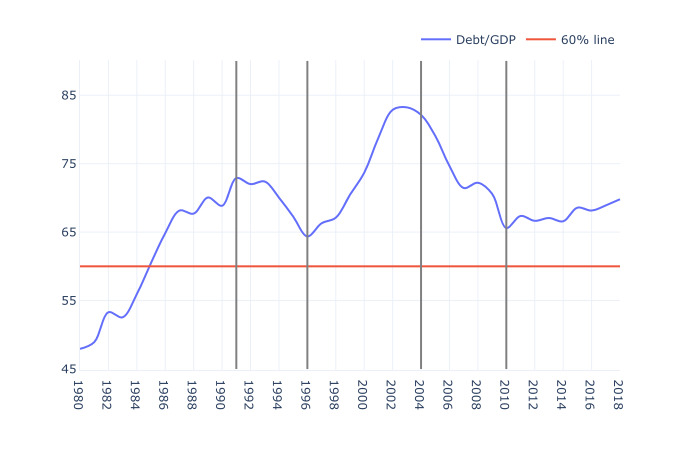
As of 2018, India’s debt ratio is more than the target (69%, as of 2020 it is estimated at 70.4% by the RBI). I use the peaks and troughs of the trajectory to periodize the debt movement.

The table shows the decomposition by period. The second column (b)is the change in debt ratio (in percentage). The third column tells what percentage of this change is due to the primary deficit (new debt issuances). The fourth column shows the percentage of change due to (i-g).In the entire period (1981-2017), the interest-growth differential has explained a larger share of the change in the debt ratio — an average of two thirds. Also, throughout the period, the growth rate is greater than the interest rate (last column).
This means that to decrease the current 70.4% to 60% by 2023, the government cannot simply reduce its new borrowings. In fact, cutting spending at a time when output is low can have negative effects. A sudden withdrawal in spending leads to a fall in output, which reflects in low GDP. This pushes the debt ratio up (denominator falls so overall ratio rises) — what Irving Fisher referred to as ‘debt deflation’. So not only will cutting spending be ineffective, it might also be counter-productive — in a strange way, trying to cut deficits can lead to higher debt!
Let us circle back to where we started — India’s growth is at -24%. As we now know, growth affects debt dynamics. How will the economic shock caused by the coronavirus affect India’s debt trajectory over the next few years?
Coronavirus and Debt Dynamics
As of 2020, the debt ratio is 70.4%. I assume that there is a steep fall in output over 2020, and a recovery in the next year. Using the equation, let’s simulate India’s debt trajectory over the next seven years:
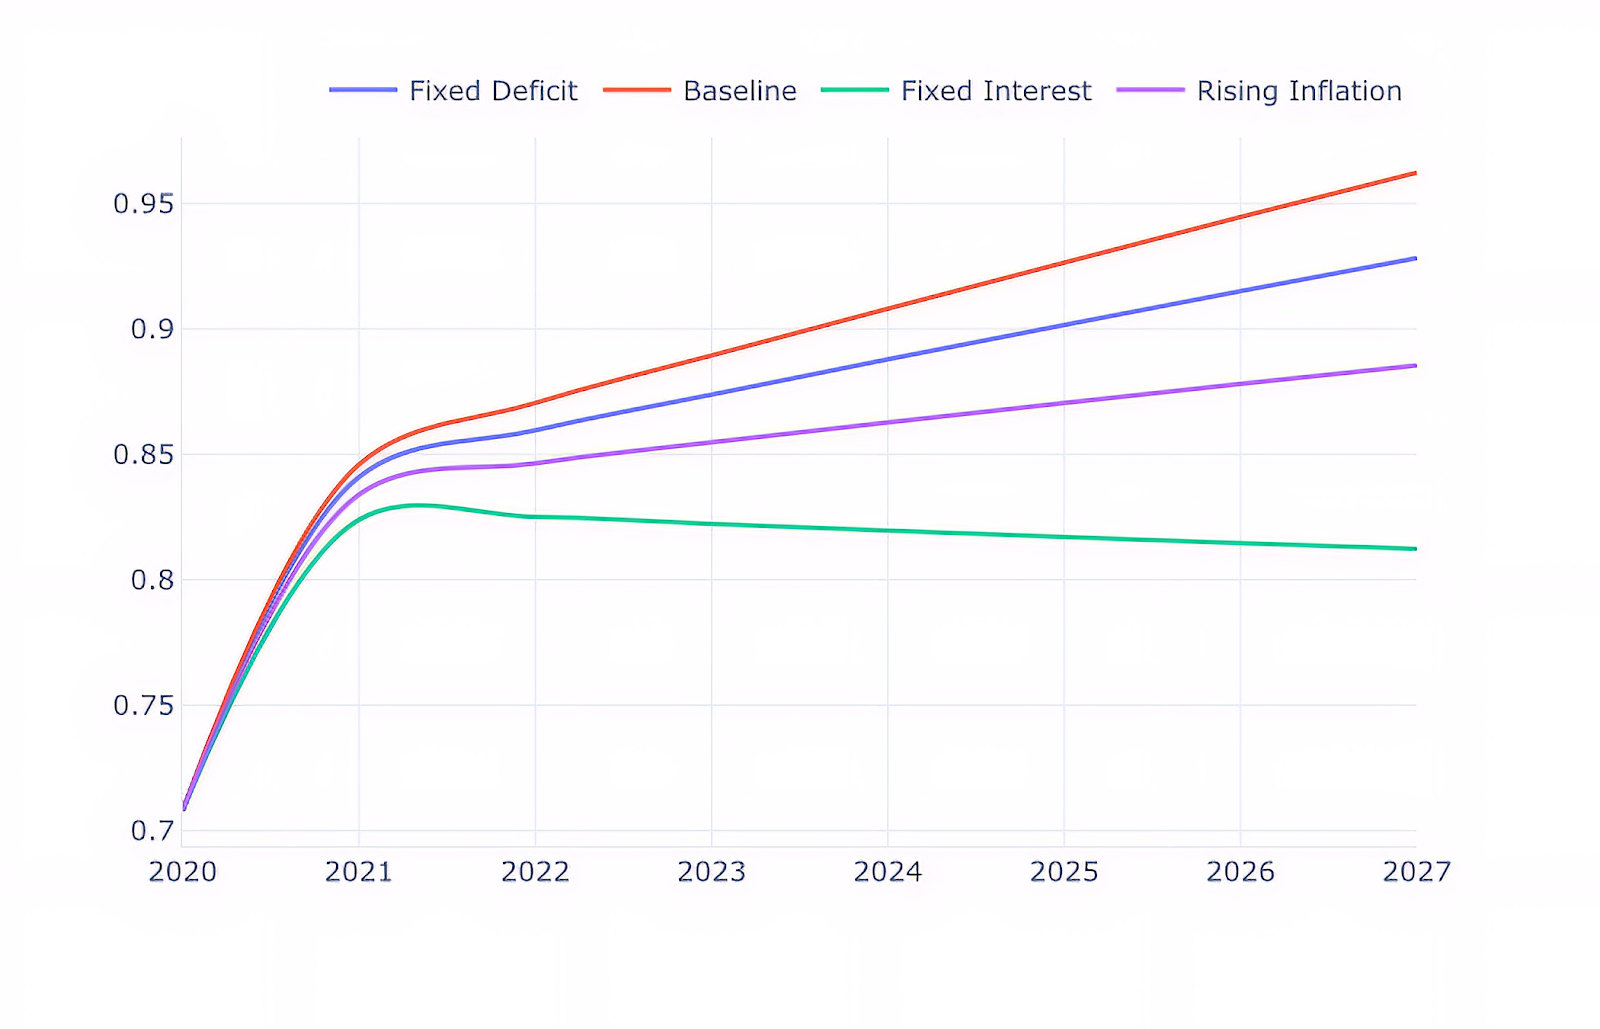
The Figure depicts four possible scenarios:
- The Baseline scenario shows how debt would change if all variables remain in the same range as they were in 2020.
- The fixed deficit scenario shows what would happen if the government tried an FRBM-style intervention — i.e. fixed new borrowings at 4%.
- The fixed interest scenario is when the central bank fixes the interest rate at 4%.
- Finally the rising inflation case depicts the scenario where inflation is in a higher range than that of the Baseline.
The best way to stabilize the debt ratio is by lowering the interest rate while following a fiscal rule is only the third best. The simulation results confirm our earlier intuition — at higher levels of debt, the interest-growth differential is a stronger determinant of the debt trajectory. The spike around 2021 only increases its power, which helps it stabilize the debt trajectory faster. Of all the four scenarios, this is actually the only situation where the debt ratio is falling.
What is the policy lesson from all this? The key insight is that reducing the cost of borrowing is more effective in stabilizing the debt ratio than cutting spending. At the same time, a revival in growth is essential for the debt ratio to stabilize, and prevent debt-deflation. An active fiscal policy, supported by generous stimulus packages is what India needs most of all now While the monetary authorities in India have been fairly active and supportive — with repeated rate cuts and moratoriums on loans — the government has been passive. With the economy already in recession, a well-targeted spending programme is essential to complement the central bank’s efforts — this will help generate employment, and also stabilize the debt ratio. All this will help get the Indian economy back on its feet.
Sign up for Notes on the Crises
Currently: Comprehensive coverage of the Trump-Musk Payments Crisis of 2025
